When a Sensor Lies
Read · 12 slides
Saturation and the Baseline That Decays
- Clipped peaks, then a baseline displaced and decaying back
- The ASD of the same record can look nearly normal
- The check is the time history at full bandwidth, not the spectrum
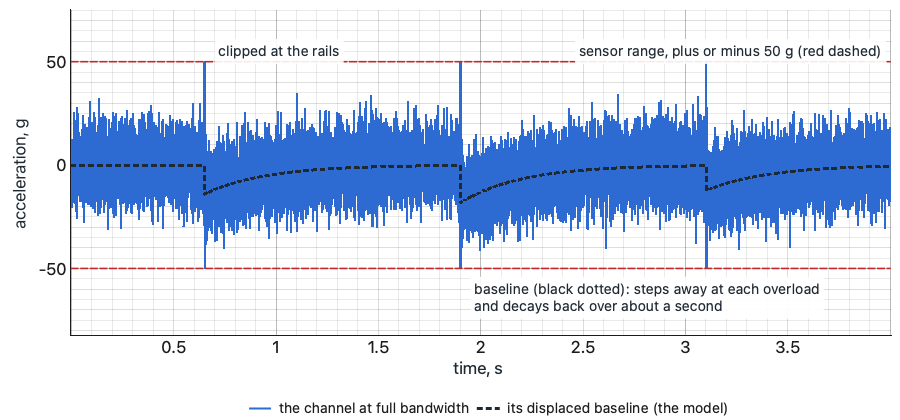
a. The time history at full bandwidth
Three overloads from a rattle far above the band: spikes to the sensor's 50 g rails, and the baseline stepping away and decaying back.
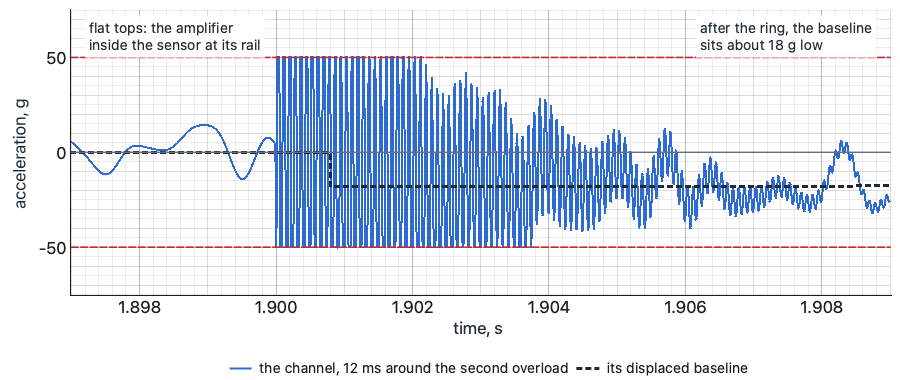
b. 12 ms around the second overload
Flat tops on both rails while the amplifier inside the sensor is saturated, then the baseline about 18 g low.
c. The ASD of the same record
The saturated record (blue dashed) drawn on the ASD of a clean record of the same motion (thick grey).
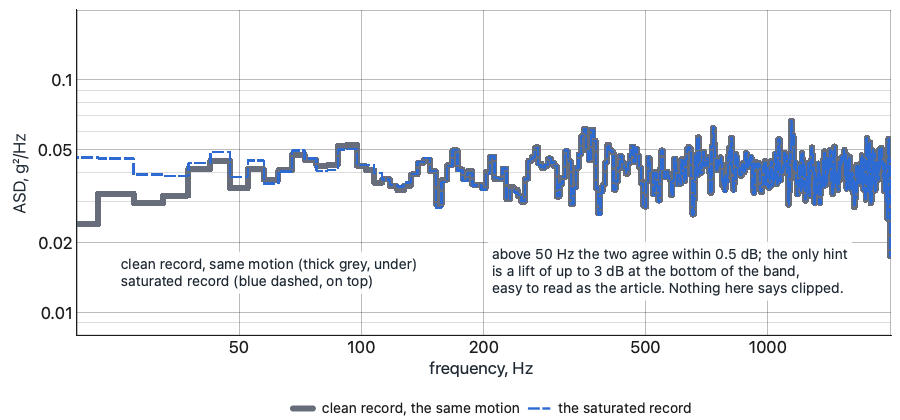
Synthetic record, the author's model of the mechanism: 9 g rms random, 20 to 2,000 Hz; a 100 mV/g sensor with a 50 g range; overloads at 12,000 Hz; recovery time constant 0.3 s.
Zero Shift on a Shock
- An offset after the pulse that is not motion, bleeding back at the chain's time constant
- Integrate to velocity: a table starts and ends at rest, so the velocity comes back to about zero
- A velocity that ramps away is the sensor, not the pulse
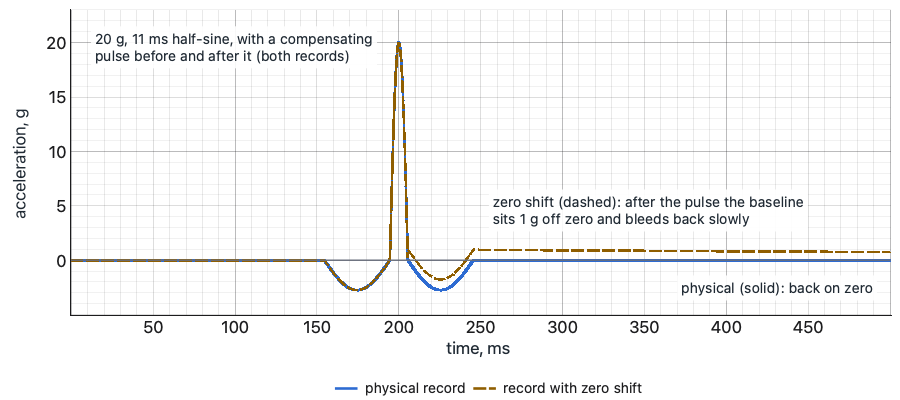
a. Acceleration
The same shaker shock twice: physical (solid) and with zero shift (dashed).
b. Velocity, the integral
The check: integrate each record to velocity. The physical one returns to zero; the one with zero shift ramps away.
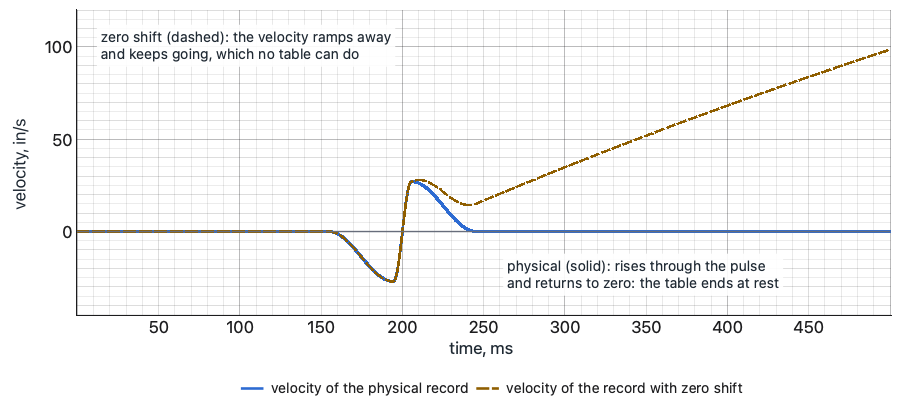
Synthetic: 20 g, 11 ms half-sine with a 2.75 g, 40 ms compensating pulse before and after; zero shift 1 g, bleeding back at a 1 s time constant. Velocity in in/s.
Hum
- A comb of narrow, steady peaks at the line frequency and its harmonics, there with the drive at zero
- The check: amplifier on, drive at zero; then break the loop and repeat
- If the comb goes, the article was never involved
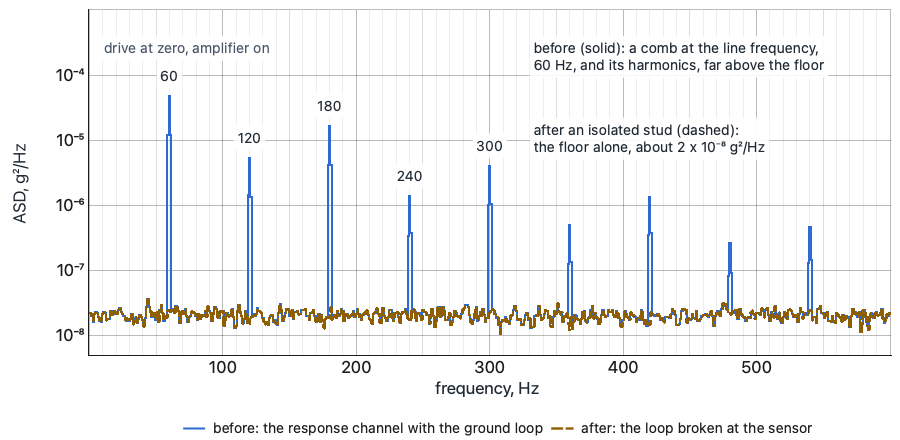
Synthetic: a floor near 2 x 10⁻⁸ g²/Hz; hum at 60 Hz and its harmonics to 540 Hz (50 Hz and its multiples where the line frequency is 50 Hz). 1 Hz lines.
Spikes and Dropouts That Follow the Cable
- Spikes that line up with the cable moving; dropouts to the baseline and back
- Both grow with level, because the cable moves more
- The wiggle test: drive at zero, the cable flexed along its run, each connector pressed and turned
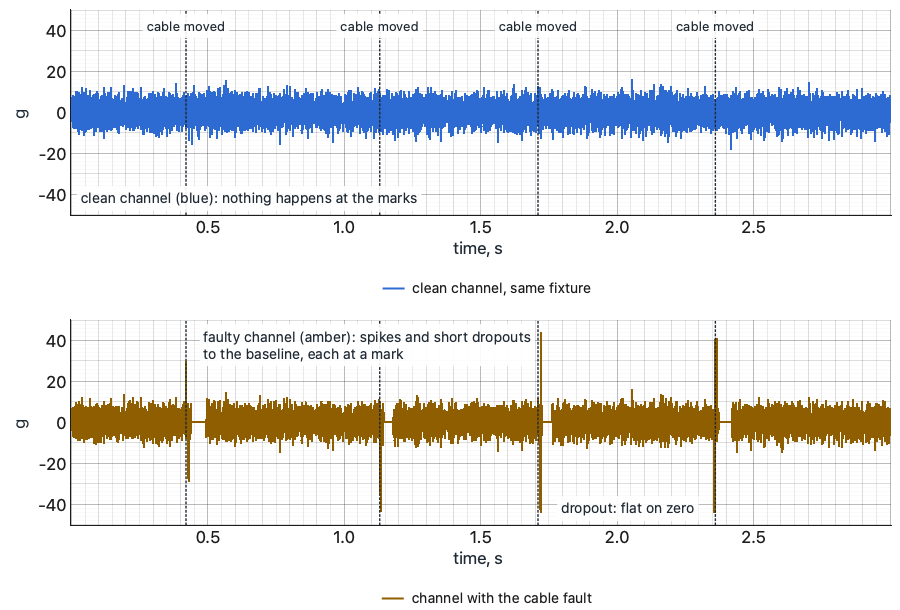
Synthetic: 4 g rms random response, 20 to 2,000 Hz; dotted lines mark when the cable moved. Top: a clean channel beside it. Bottom: the channel with the fault.