Read sensitivity, range, frequency limits, transverse and base-strain sensitivity, temperature and mass
Say which one limits this test
Sensitivity Belongs to a Serial Number
The datasheet gives the model's nominal, with a tolerance
The certificate gives this serial number at the reference frequency on the day: that is the number entered
A table carrying the nominal, or the last sensor's, is wrong by the difference, and the screen does not show it
Range Against the Response, Not the Profile
A 2 g sine on a resonance with a Q of 25: 50 g, the whole range of a 100 mV/g IEPE sensor
A 15 grms random channel: peaks of 45 g, three times the rms, many times a minute
A shock rings at the article's modes beyond the pulse's peak
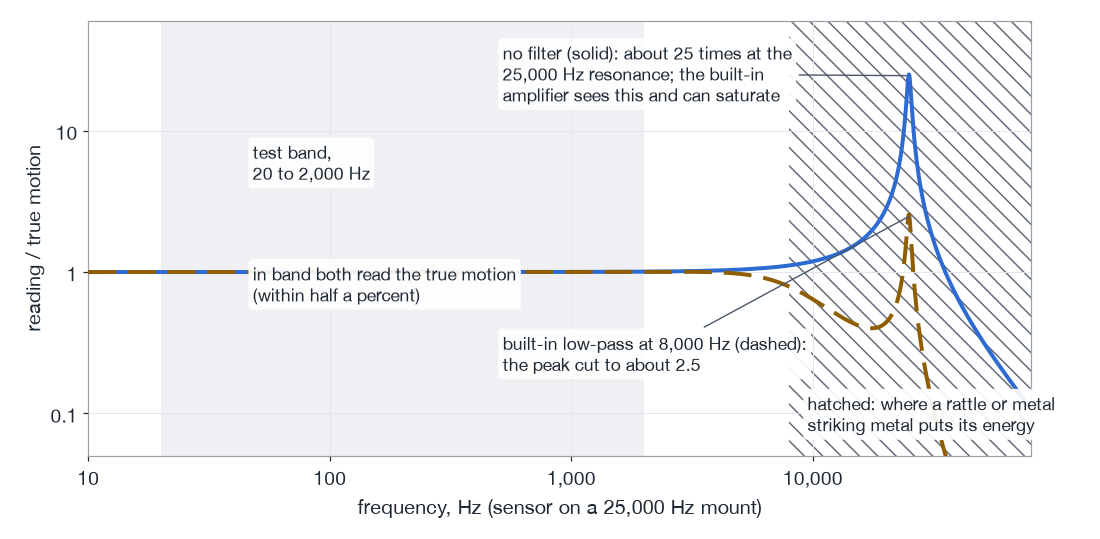
Out of band too: chatter and rattles excite the sensor's own resonance
The Mounted Resonance and the Usable Fraction
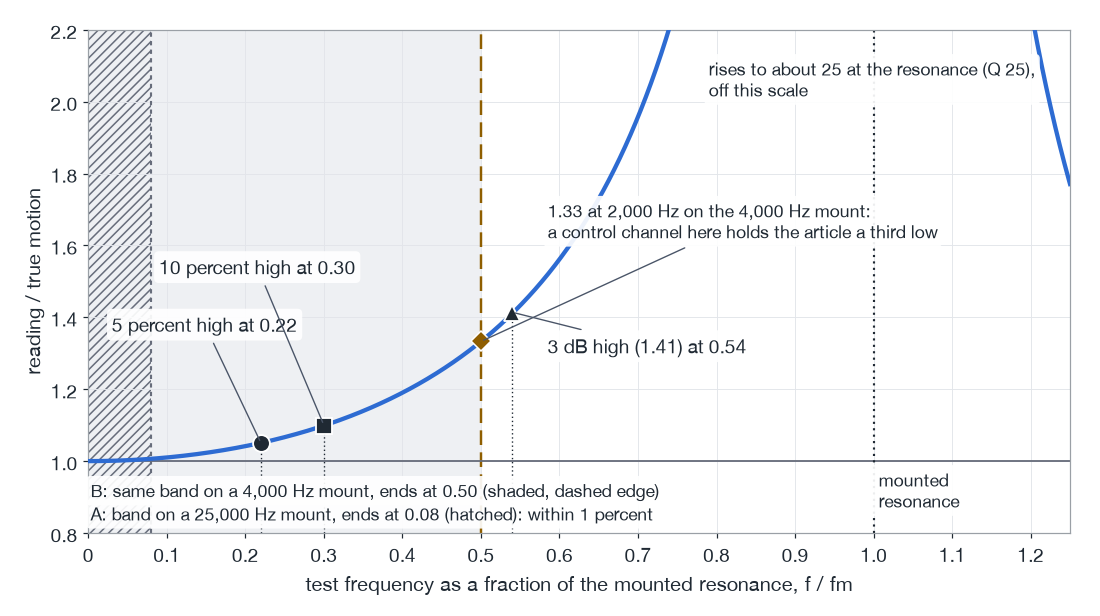
Below its mounted resonance the sensor reads high, more as the frequency climbs
5 percent high at about 0.22 of it, 10 percent at about 0.30, 3 dB at about 0.54
The datasheet's resonance is the ceiling; on the test it is never higher
a. The reading across the fraction of mounted resonance
One lightly damped resonance (Q 25). Circle, square and triangle: 5 percent, 10 percent and 3 dB high. The band of a 2,000 Hz random test on a 25,000 Hz mount (hatched, A) and on a mount gone soft to 4,000 Hz (shaded, B).
b. Inset: the resonance excited from far above the band
The same sensor on its 25,000 Hz mount, with no filter (solid) and with a built-in two-pole low-pass at 8,000 Hz (dashed). In band they agree; at the resonance the filter cuts the peak about tenfold.
Synthetic, the author's model; every value assumed and stated in the notes. The marks are the single-resonance arithmetic of the text.
Figure 1.3. A sensor's reading against the true motion, as a ratio, across the test frequency as a fraction of the mounted resonance: flat at the left, rising through 5 percent at about 0.22, 10 percent at about 0.30 and 3 dB at about 0.54, then the resonance itself. The test band of a 2,000 Hz random test is shaded for two mounted resonances, one where the band sits in the flat region and one where it reaches the rise. An inset shows the sensor's resonance excited by content far above the band, with and without a built-in low-pass filter in the sensor.
The Top of the Band as a Fraction
514.8 and 516.8 ask for flat within plus or minus 5 percent across the band
So the top of the band at no more than about 0.22 of the mounted resonance
Random to 2,000 Hz needs a mounted resonance above about 9,000 Hz
Brought down to 4,000 Hz, the sensor reads a third high at 2,000 Hz; a control channel on it holds the article a third low
The Low End, Transverse and Base Strain
The low end: the time constant on a piezoelectric sensor, zero on a piezoresistive or capacitive one
Transverse sensitivity stops being small where the cross-axis motion is large
A cube fixture's face at its first resonance: 5 percent becomes up to about 8 percent
Base strain: nothing on a thick block, more than any other line on a thin panel
Temperature and Mass
Two lines: the operating limit, and the sensitivity against temperature
514.8: within plus or minus 5 percent at the test temperature relative to the calibration temperature
The author's practice: a sensor below one-tenth of the effective mass at its mount
A tenth more mass pulls a resonance down about 5 percent
Which Line Limits This Test
A small electronics box in a hot chamber, random to 2,000 Hz, a channel on its thin lid
Range: the lid's own resonance; frequency: mounting on a painted lid nobody may drill
Temperature: the chamber against the IEPE datasheet; mass: a lid barely heavier than the sensors
Decide
Range against the expected peak response at that point, with headroom for resonance, random peaks and out-of-band content
The top of the band no more than about 0.22 of the mounted resonance where 5 percent flatness is asked
Temperature limits and the sensitivity curve against the chamber
On a light structure, its mass against the structure's; the numbers written in the channel table
This page is part of the KCSC Training course and is licensed to one named reader for viewing. It does not print. Lab kit pages print from the Lab Kit menu.